

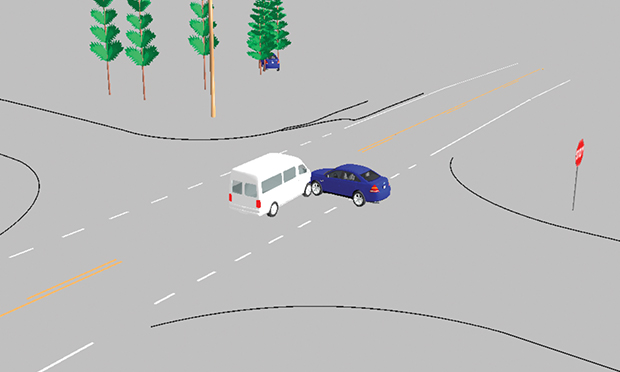
 While
photographs show what happened following an accident, a diagram can
show pre-collision movement. (Photo: The Warren Group)
While
photographs show what happened following an accident, a diagram can
show pre-collision movement. (Photo: The Warren Group)
When it comes to diagramming a crash scene, there are several methods to complete the task. Forensic mapping, (locating, positioning and documenting the evidence of a collision scene to scale) is essential to having the answers to the questions, "who, what, where, when and why." Photographs do a great job of showing what the investigators saw post-collision, yet they lack scale and the ability to describe pre-collision movement. Having a computer-aided diagram (CAD) of the collision scene goes much further than pictures can; here is why.
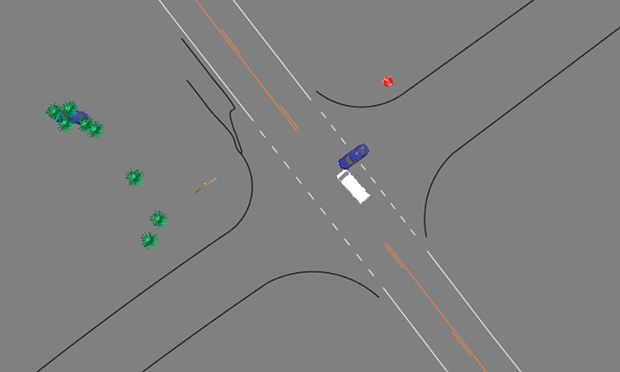 Figure 1. (Photo: The
Warren Group)
Figure 1. (Photo: The
Warren Group)
A scale diagram (Figure 1) gives the full overview of a collision scene from either a 2D or 3D point of view. Being able to see how things lined up, how they came together and how they parted helps explain the events within a crash. When a scene can be viewed from top down or any angle, that helps relay the facts. The investigator, judge or jury will get a visual idea of what was happening up to, at and after impact.
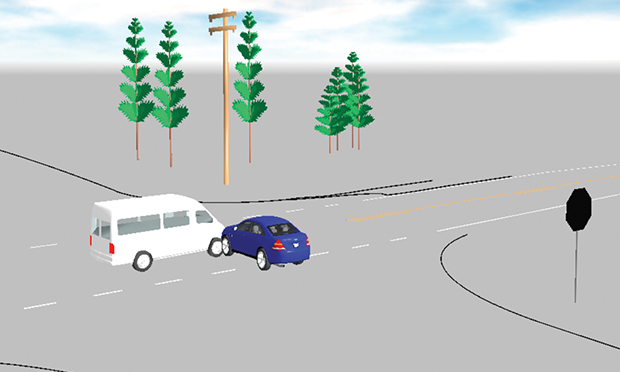 Figure 2. (Photo: The
Warren Group)
Figure 2. (Photo: The
Warren Group)
Using properly documented physical evidence (Figure 2) in conjunction with the layout of the roadway in the area helps to tell the story from approach to final rest. Photographs limit the viewer to only seeing what was there in the aftermath and can also skew the perspective as to the position or distance captured within the frame.
Low-tech vs. high-tech
Using forensic mapping technology (a laser scanner, drone, total station or some other method of gathering data points for evidence) reduces time and adds detail that hand drawings lack. Gathering data by hand with a 100-foot tape measure takes time and being in the roadway is dangerous. The use of advanced technology reduces the time needed and simplifies the task of capturing the data as well as reduces the threat to an investigator.
To complete a CAD scale diagram, high-tech equipment is used to plot points throughout the crash site. For example, using the Sokkia Total Station, relevant points are mapped and coded by the investigator while the station relates each of them to its location. These points may be roadway lines, utility poles, skid marks, or any other item that helps to detail the scene or explain the collision.
Want to continue reading?
Become a Free PropertyCasualty360 Digital Reader
Your access to unlimited PropertyCasualty360 content isn’t changing.
Once you are an ALM digital member, you’ll receive:
- All PropertyCasualty360.com news coverage, best practices, and in-depth analysis.
- Educational webcasts, resources from industry leaders, and informative newsletters.
- Other award-winning websites including BenefitsPRO.com and ThinkAdvisor.com.
Already have an account? Sign In
© 2024 ALM Global, LLC, All Rights Reserved. Request academic re-use from www.copyright.com. All other uses, submit a request to [email protected]. For more information visit Asset & Logo Licensing.


