

Consumer driven health plans in the United States experiencedcontinued growth this year, though at a slower rate than in 2009and 2010, according to preliminary results released by UnitedBenefit Advisors from its 2011 UBA Health Plan Survey.
|The survey is the nation’s largest health plan benchmarkingsurvey, with more than 16,000 plans from nearly 11,000employers.
|CDHPs grew at a rate of 13.9 percent this year, stillsignificant, but only about two-thirds the growth rate of 2010.Currently, CDHPs represent 22.9 percent of all plans offered andcover 17.3 percent of employees, a greater percentage of employeesthan are now covered in HMOs (11.9 percent), according to BillStafford, UBA vice president, member services.
|The Northeast region of the country had the largestconcentration of CDHPs (31.3 percent), followed by the Southeastregion (27.4 percent). The average cost increase for all CDHPs at8. percent was slightly lower than that of the average of all plantypes, which increased 8.2 percent this year.
|To help employees offset the higher out-of-pocket expenses underCDHPs, employers are offering health reimbursement arrangement or ahealth savings account and contributing funds. The survey found theaverage employer contribution to an HRA was $1,656 (up from $1,481in 2010) for a single employee and $3,198 for a family (up from$2,857 in 2010).
|“For the first time in more than seven years of reporting, CDHPsnationally did not create a savings over the clients’ in-force planprior to renewal. This year experienced an increase (2.1 percent),albeit less than the average 8.2 percent increase of all plans,”Stafford says. “As these plans become more prevalent, thepercentage of savings has continually declined.”
|“We anticipate that in spite of passage of health care reformefforts, health care costs will continue to increase. There stillneeds to be concerted efforts to change or alter the underlyinghealth care issues that control costs,” Stafford says
|Other key findings from the survey: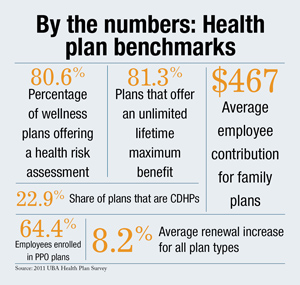
- The average renewal increase for all plan types was 8.2percent.
- PPO plans have nearly two-thirds of all enrolled employees(64.4 percent).
- The average employee contribution for plans with contributionsfor all plan types is $117 for single and $467 for family.
- Four-fifths of all wellness plans (80.6 percent) offered ahealth risk assessment.
- As a direct result of health care reform criteria, 81.3 percentof all plans now offer an unlimited lifetime maximum benefitcompared to just 16.1 percent in 2010.
- Of all plans in the Northeast, 80.7 percent still have 100percent coinsurance, a decline of only 1 percent from 2010.
- About half of all covered employees also elected to cover theirdependents, a decline of 6 percent.
“The intent of the survey is to provide employers of all sizeswith the data they need to manage their health care benefitprograms effectively,” Stafford says. “Especially for employerswith fewer than 1,000 employees (which represents more than 99percent of the employers in the U.S.)--and for employers who haveoperations in multiple locations, this survey is the best source ofreliable regional--and in many cases, statehealth plan benchmarksby employer size and industry categories.”
Complete your profile to continue reading and get FREE access to BenefitsPRO, part of your ALM digital membership.
Your access to unlimited BenefitsPRO content isn’t changing.
Once you are an ALM digital member, you’ll receive:
- Critical BenefitsPRO information including cutting edge post-reform success strategies, access to educational webcasts and videos, resources from industry leaders, and informative Newsletters.
- Exclusive discounts on ALM, BenefitsPRO magazine and BenefitsPRO.com events
- Access to other award-winning ALM websites including ThinkAdvisor.com and Law.com
Already have an account? Sign In
© 2024 ALM Global, LLC, All Rights Reserved. Request academic re-use from www.copyright.com. All other uses, submit a request to [email protected]. For more information visit Asset & Logo Licensing.


